Seed stage | Saudi construction tech
Executive Overview
Growth, cash, valuation, and readiness.
Scenario
Scenario Workspace
Save, duplicate, compare
Base, Downside, and Upside are always available for comparison.
Autosave is ready for working edits.
Excel Import / Refresh
Upload a refreshed QUOTAH model
Current source: audited built-in model.
Audit Trail
Assumption changes and KPI impact
Investor Export Pack
PDF, scenarios, audit log, KPIs, chart images
Investor PDF
Scenario summary
Assumption change log
KPI snapshot
Charts as images
Ready to export the current investor case.
Right Sidebar Manual
Field-by-field explanation document
Use this when reviewing what every input changes and how it affects the investor model.
Data Validation Warnings
Live model-quality checks
MarketSAM and penetration
RevenueRamps, usage, pricing
CostsTeam, infrastructure, spend
FundingRound and use of funds
ValuationOwnership and multiple
Investor equity16.80%
Unit economicsCustomer economics
Investor Readiness
Audit gateUse of Funds
Year 1Valuation Bridge
Seed terms60-Month Revenue Ramp
Monthly | SAROperating Drivers
End of periodRevenue Mix
AnnualPricing Architecture
ACE / APE / MarketplaceUse-of-Funds Cost Structure
By categoryRole Headcount Editor
Year 5 baselineClosing Cash Trend
Monthly | SARMonthly Burn Schedule
Opening to closing cashAnnual P&L Stack
Revenue to net profitAnnual Statement
Excel baselineAnnual Cash Bridge
Annual | SARCash Flow Statement
Excel baselineLTV / CAC Benchmark
Healthy SaaS target: 3x+Metric Definitions
Source modelScenario Year 5 Revenue
Market penetrationValuation Checks
Before investor releaseValuation Sensitivity Tornado
Downside / upside rangeWhat Moves Valuation Most?
Ranked drivers
Investor presentation
Business Plan

Building the intelligence layer of the construction industry.
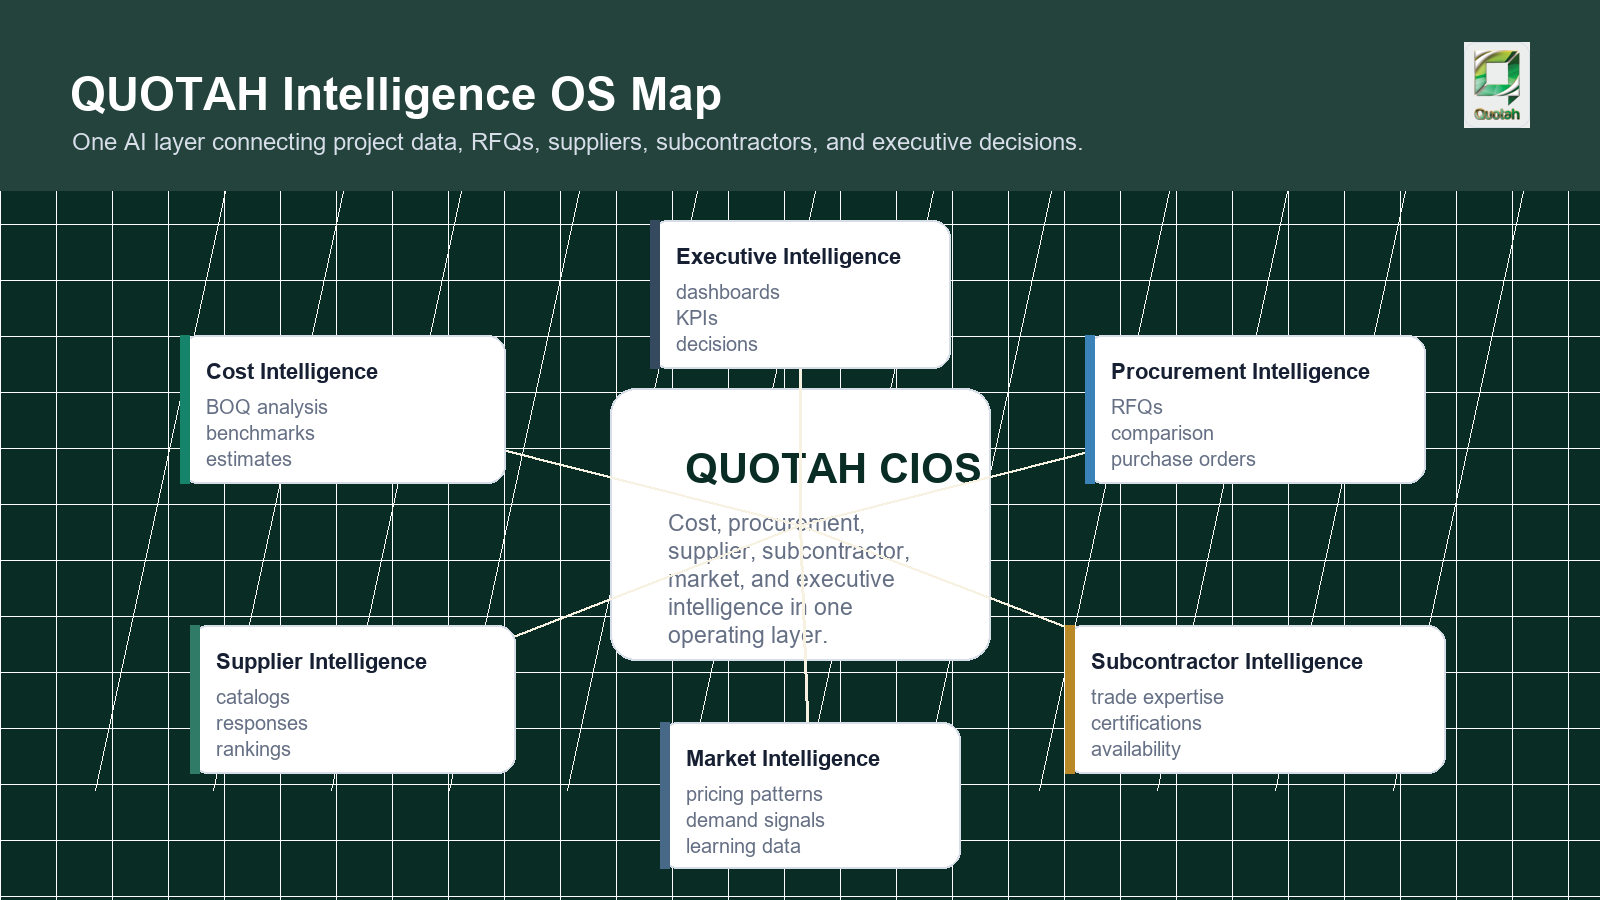
QUOTAH is a Construction Intelligence Operating System for AI-powered cost intelligence, procurement workflows, supplier and subcontractor matching, quotation comparison, purchase orders, and executive visibility.



 Company and market
Executive summary, company overview, industry analysis, and market opportunity.
 Problem and solution
Problem statement, QUOTAH solution, AI framework, and technology architecture.
Commercial engineProduct ecosystem, business model, go-to-market, and marketing growth.
 Operating discipline
Operations, product roadmap, financial strategy, risk mitigation, competition, and governance.
 Scale and investment
Implementation, GCC expansion, investor value, exit logic, and Vision 2030 alignment.
01 Executive Summary02 Company03 Industry04 Market05 Problem06 Solution07 AI Framework08 Architecture09 Ecosystem10 Model11 GTM12 Growth13 Operations14 Roadmap15 Financials16 Risk17 Competition18 Governance19 Implementation20 Closing
Foundation, identity, market timing, and reachable demand.
Chapters 1-4 explain why QUOTAH exists, why Saudi Arabia is the first market, who the platform serves, and why the launch window is attractive now.
- CIOS unifies project intelligence, BOQ analysis, RFQs, supplier and subcontractor matching, quotations, purchase orders, and market intelligence.
- Every completed project strengthens the knowledge network and improves future recommendations.
- Current stage includes functional MVP, operational web platform, core AI engines, pilot preparation, financial model, and investor materials.
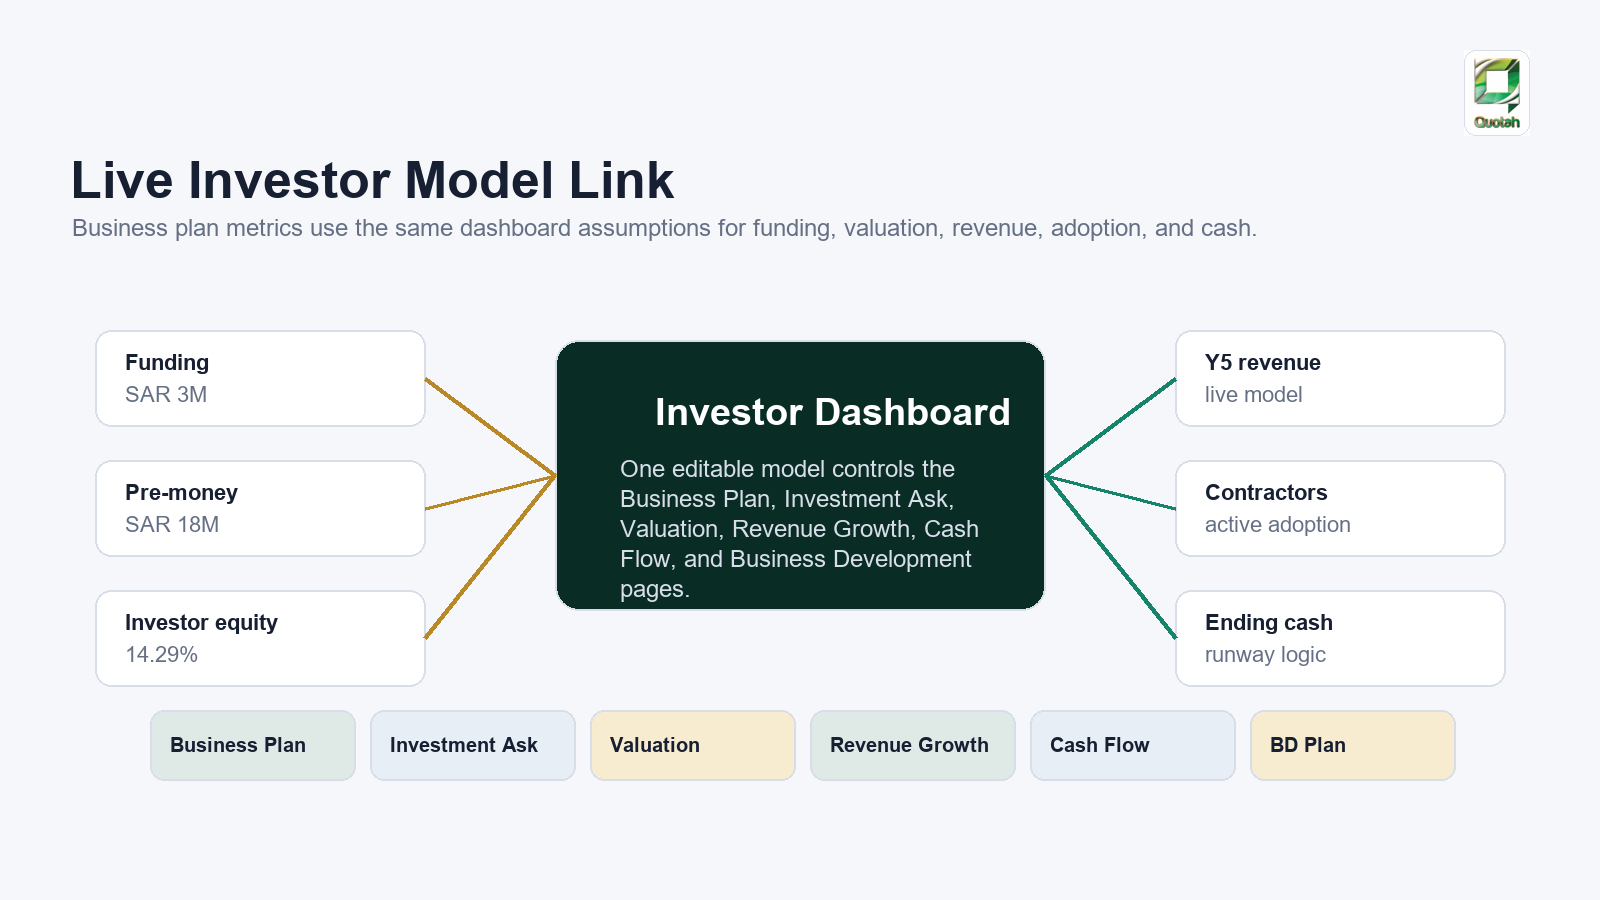
- Investor terms are aligned to the dashboard: SAR 3M round, SAR 18M pre-money, and 16.80% target investor equity.
- Category: ConTech, AI, enterprise SaaS, procurement technology, marketplace, and AI-as-a-service.
- Vision: become the trusted Construction Intelligence Operating System for smarter commercial decisions.
- Mission combines AI, procurement intelligence, market intelligence, engineering expertise, and human collaboration.
- Values and objectives focus on innovation, trust, collaboration, commercial launch, enterprise customers, and regional leadership.
- Construction remains one of the largest and least digitized sectors, with procurement and commercial management still fragmented.
- Vision 2030, giga-projects, infrastructure investment, and urban development create strong Saudi demand.
- AI is reshaping cost estimation, quantity takeoff, procurement, supplier selection, forecasting, and document analysis.
- The gap is a single AI-driven ecosystem for cost, procurement, suppliers, subcontractors, BOQs, RFQs, market intelligence, and learning.
- TAM includes contractors, developers, suppliers, manufacturers, distributors, consultants, and subcontractors.
- SAM focuses on organizations with active procurement departments and recurring commercial decision needs.
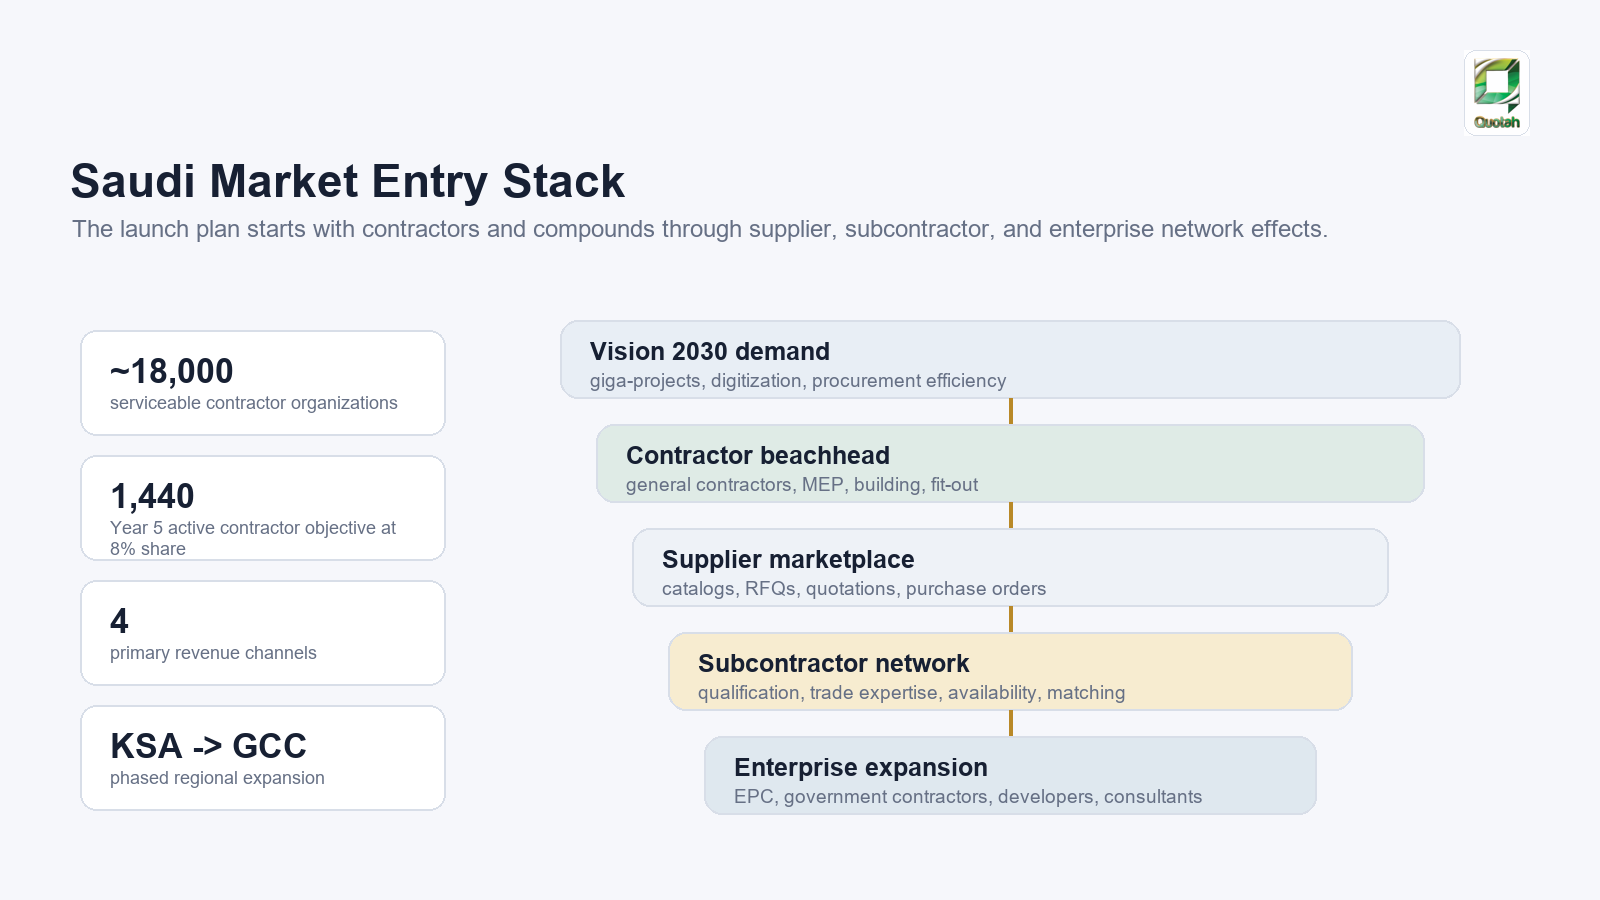
- SOM targets around 18,000 contractors, with a Year 5 objective near 8% share, about 1,440 active contractors.
- Segmentation covers small, medium, large, and mega contractors, plus supplier and subcontractor participation.
From fragmented workflows to an AI-first operating system.
Chapters 5-8 define the pain, the CIOS solution, the AI framework, and the enterprise architecture needed to scale safely.
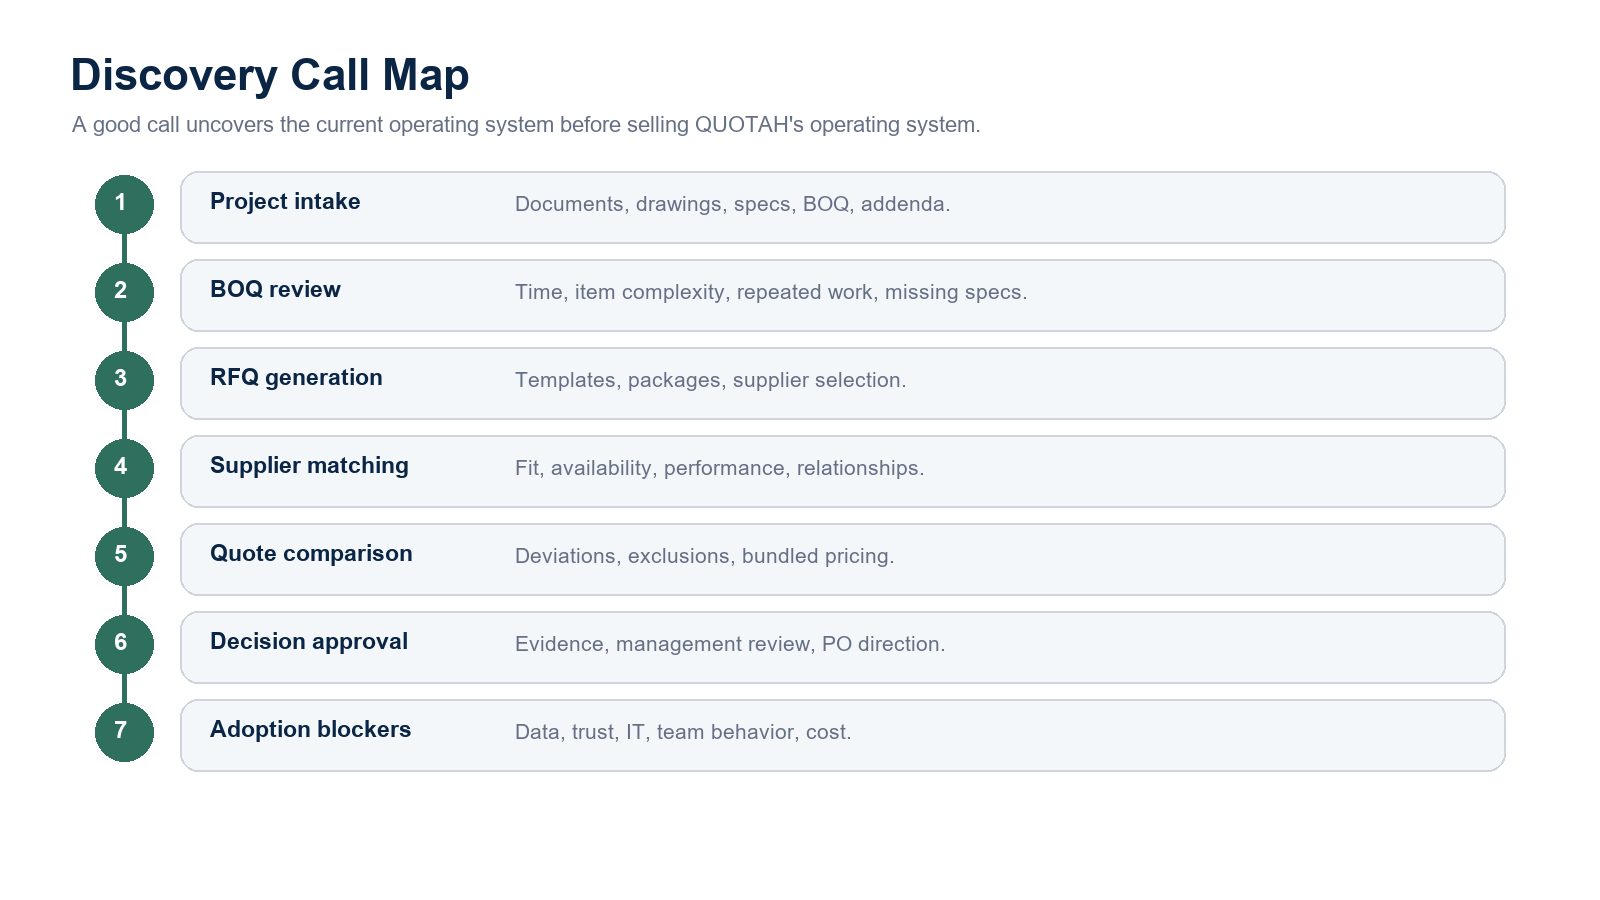
- Procurement still runs across spreadsheets, emails, disconnected software, and repeated manual engineering work.
- Cost estimation suffers from manual drawing interpretation, inconsistent BOQ analysis, senior-engineer dependency, and limited reuse of history.
- Supplier and subcontractor decisions lack structured visibility into capability, pricing, delivery, availability, and performance.
- Knowledge loss and data fragmentation increase costs, delay purchasing, reduce profitability, and create commercial risk.
- CIOS connects engineering, procurement, commercial management, suppliers, subcontractors, and executives in one learning ecosystem.
- The workflow covers project intelligence, cost intelligence, procurement, supplier selection, quotation analysis, purchasing, and organizational learning.
- Modules include Cost Intelligence, Procurement Intelligence, Supplier Intelligence, Subcontractor Intelligence, Market Intelligence, and Executive Intelligence.
- The intelligence flywheel improves as projects, BOQs, RFQs, quotations, purchase orders, and outcomes accumulate.
- AI design principles: construction-specific intelligence, human-centered decisions, continuous learning, explainability, scalability, security, and governance.
- Engines include cost intelligence, procurement intelligence, supplier intelligence, subcontractor intelligence, market intelligence, and executive intelligence.
- AI governance covers human approval, audit trails, secure data handling, role-based access, compliance, monitoring, retraining, and model validation.
- Future roadmap includes predictive procurement, forecasting, intelligent negotiations, contract analysis, sustainability intelligence, and strategic planning.
- Cloud-native, modular, AI-first, API-driven, enterprise-ready, and future-proof architecture.
- Five integrated layers: presentation, application, artificial intelligence, data, and infrastructure.
- multi-tenant SaaS isolates each customer while supporting centralized updates, scaling, and shared infrastructure.
- Architecture includes APIs, ERP/BIM integrations, cybersecurity, monitoring, high availability, disaster recovery, and future AI agents, digital twins, IoT, ESG, and audit trails.
Ecosystem, revenue model, GTM, and marketing growth.
Chapters 9-12 show how the platform creates value for every stakeholder, monetizes usage, enters Saudi Arabia, and builds a category-defining brand.
- Contractor workspace: project management, BOQ analysis, cost estimates, RFQs, supplier selection, purchase orders, dashboards, and analytics.
- Supplier workspace: catalogs, qualified RFQs, quotation submission, order monitoring, performance analysis, and structured sales engagement.
- Subcontractor workspace: qualifications, certifications, trade expertise, project history, availability, and opportunity access.
- Executive and admin workspaces provide KPIs, permissions, AI settings, audit logs, APIs, subscriptions, and knowledge flow across the organization.
- Revenue streams include contractor subscriptions, AI pay-per-use services, supplier marketplace commissions, and enterprise solutions.
- Customer segments include contractors, suppliers, subcontractors, EPC companies, government contractors, and large enterprises.
- Growth is supported by direct sales, partnerships, digital marketing, referrals, ecosystem effects, pilots, subscriptions, expansion, and advocacy.
- Long-term monetization includes AI agents, predictive procurement, premium analytics, ESG intelligence, financing, insurance, and marketplace advertising.
- Saudi Arabia is the beachhead because of Vision 2030, mega projects, digitization pressure, and procurement-efficiency demand.
- Targets include SMEs, large contractors, enterprise organizations, general contractors, MEP contractors, building contractors, and fit-out specialists.
- Channels include direct sales, strategic partnerships, LEAP and industry events, digital marketing, and referral programs.
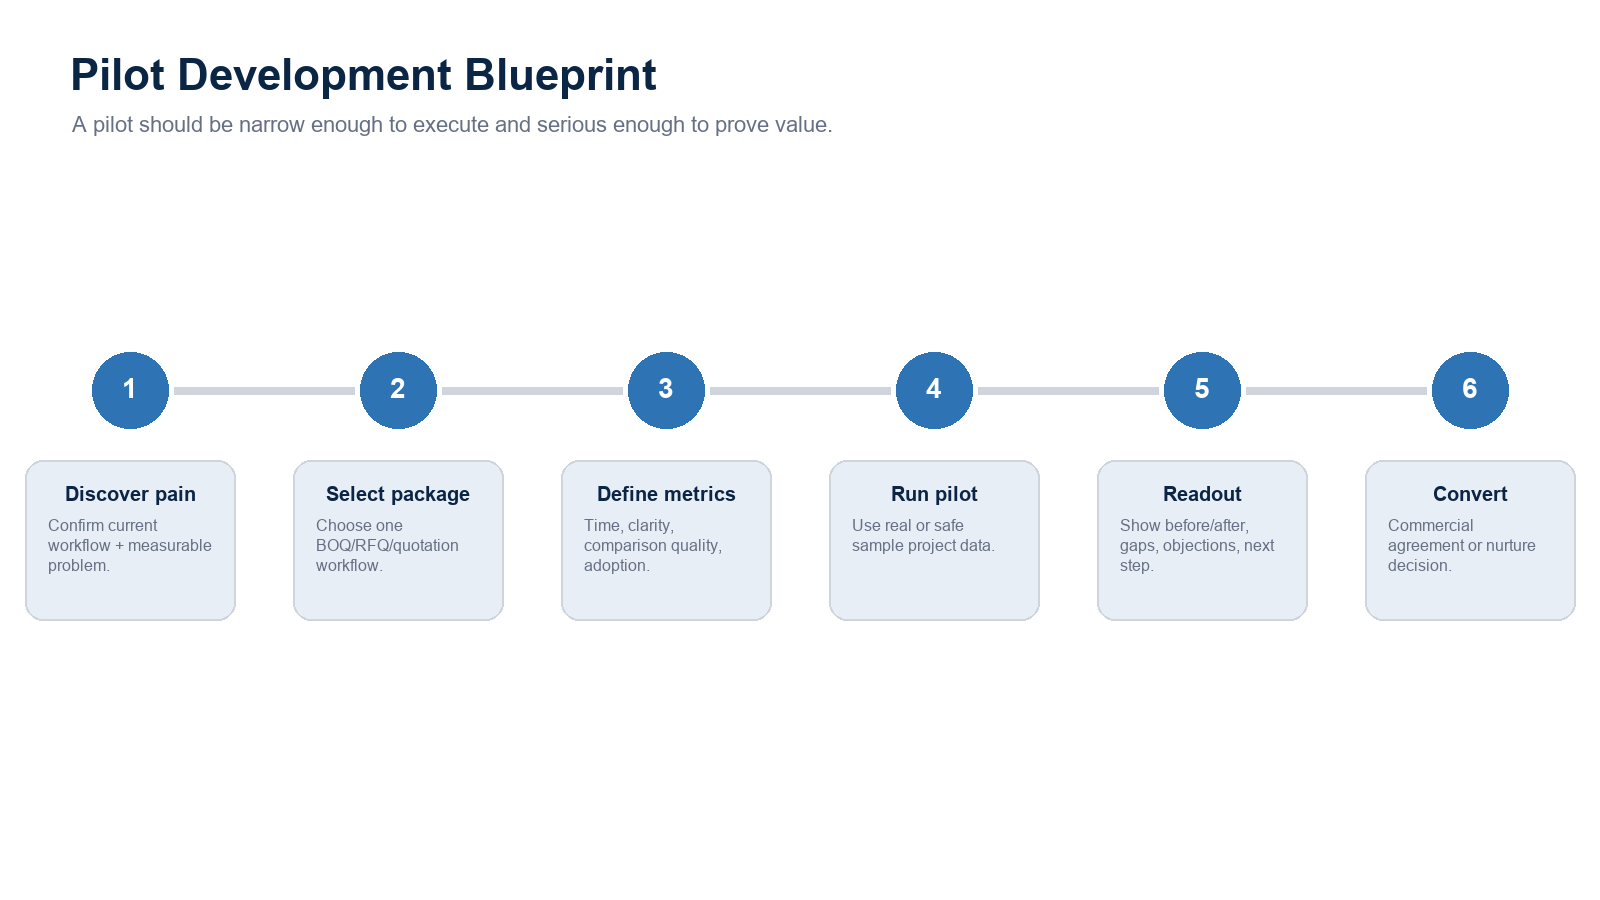
- Pilot projects validate ROI, procurement savings, AI performance, success stories, onboarding, adoption, quarterly reviews, and expansion.
- Positioning: making construction procurement smarter through artificial intelligence.
- Audience includes contractors, commercial teams, suppliers, investors, consultants, government entities, and technology partners.
- Channels include SEO, website, LinkedIn, YouTube, email, content, events, webinars, campaigns, case studies, white papers, and market reports.
- KPIs include website traffic, MQLs, SQLs, CAC, LTV, conversion rates, ROMI, referrals, retention, and brand awareness.
Execution quality, product evolution, capital discipline, and risk control.
Chapters 13-16 convert the vision into operating systems: SaaS delivery, roadmap, funding plan, KPIs, and enterprise risk management.
- Operating philosophy: customer-centricity, automation, AI-assisted decisions, continuous improvement, scalability, and security.
- Structure covers executive management, product engineering, AI teams, commercial operations, customer support, and corporate services.
- Processes include agile development, onboarding, configuration, training, data migration, pilots, go-live, AIOps, support, and release quality assurance.
- KPIs include uptime, response times, CSAT, NPS, AI accuracy, onboarding speed, release frequency, and support resolution performance.
- Vision covers cost intelligence, procurement, suppliers, subcontractors, commercial intelligence, and predictive analytics.
- Methodology uses customer-driven innovation, AI-first design, modular architecture, Agile, DevSecOps, continuous delivery, and data-driven prioritization.
- Roadmap phases include Foundation, Commercial Expansion, Intelligence Platform, and full Construction Intelligence Operating System.
- Innovation pipeline includes AI Procurement Copilot, Construction GPT, intelligent document processing, autonomous workflows, predictive pricing, integrations, and R&D.
- Seed capital accelerates commercialization, product completion, AI capability, and scalable growth.
- Use of funds covers product development, commercial growth, operations, technology infrastructure, and working capital.
- Revenue growth comes from subscriptions, AI services, supplier marketplace commissions, and enterprise solutions.
- KPIs include ARR, MRR, EBITDA, gross margin, CAC, LTV, burn rate, cash runway, churn, NRR, free cash flow, investor value, and exit optionality.
- ERM cycle: identify, assess, prioritize, mitigate, implement, monitor, review, and improve.
- Risk categories include strategic, market, competitive, technology, AI, cybersecurity, operational, financial, legal, and regulatory risks.
- Mitigations include validation, agile planning, flexible pricing, enterprise contracts, DevSecOps, redundancy, MFA, encryption, audits, scenario planning, and legal oversight.
- Business continuity, KRIs, executive oversight, accountability, transparency, and continuous improvement protect investor confidence.
Moat, governance, milestones, and final investment thesis.
Chapters 17-20 show why the category is defensible, how the company is governed, what milestones matter, and how investor value is created.

- Competitive landscape includes ERP systems, construction management platforms, estimating software, procurement tools, spreadsheets, email, WhatsApp, and manual processes.
- Positioning differentiates QUOTAH through construction-specific AI, marketplace capability, subcontractor matching, executive intelligence, and continuous learning.
- Barriers to entry include proprietary AI, accumulated construction knowledge, network effects, switching costs, and industry credibility.
- Blue-ocean strategy creates the Construction Intelligence Operating System category instead of competing as another ERP or procurement tool.
- Leadership philosophy: vision, customer obsession, data-driven decisions, innovation, accountability, and operational excellence.
- Organization includes executive leadership, product and engineering, commercial, customer success, and corporate services.
- Board oversight, advisory board expertise, shareholder rights, voting, equity management, funding rounds, exits, and decision authority define governance.
- Culture, talent acquisition, ESG, succession planning, governance KPIs, compliance, and employee engagement support sustainable scale.
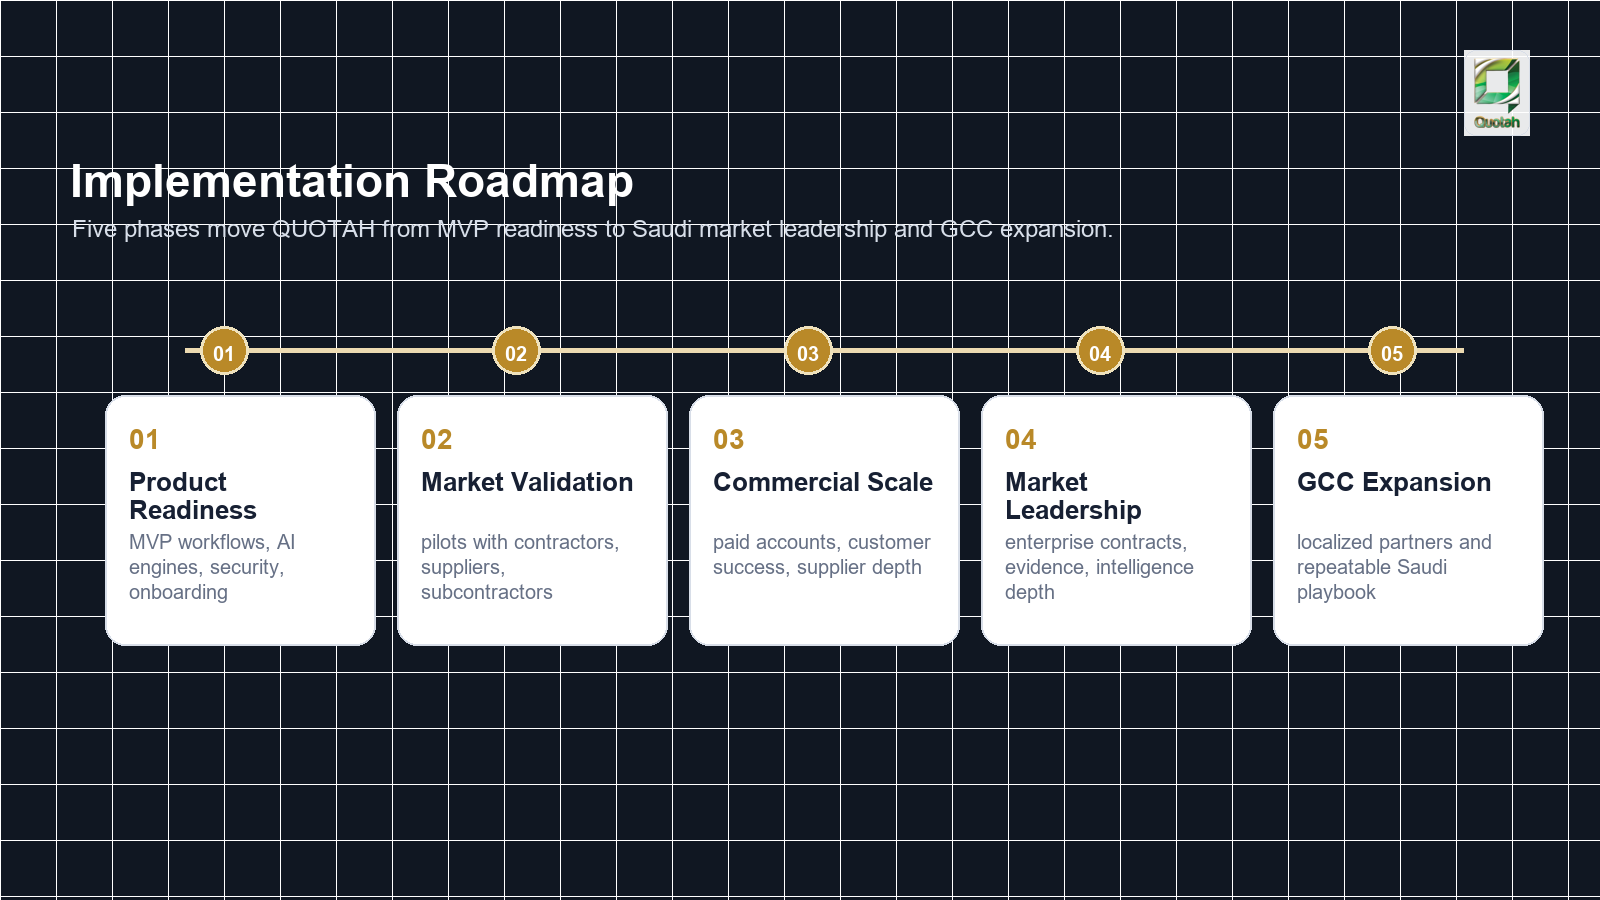
- Execution phases: Product Readiness, Market Validation, Commercial Scale, Market Leadership, and Regional Expansion.
- Roadmap includes platform completion, pilot deployment, commercial launch, enterprise infrastructure, and AI validation.
- Milestones include customers, suppliers, recurring subscriptions, partnerships, marketplace expansion, AI enhancements, APIs, mobile optimization, and team growth.
- KPI dashboard measures ARR, MRR, customer growth, AI accuracy, EBITDA, gross margin, Vision 2030 alignment, and market leadership.
- Investment thesis combines AI, ConTech, enterprise SaaS, procurement technology, marketplace economics, and data intelligence in one scalable platform.
- Highlights include large market, AI-first architecture, recurring revenue, multiple monetization streams, operating leverage, and network effects.
- Investor value is created through customer acquisition, ARR growth, AI leadership, marketplace expansion, operational excellence, and GCC scaling.
- Exit paths include strategic acquisition, growth-equity rounds, and IPO potential once sufficient scale is achieved.
MVP workflows, AI engines, security baseline, onboarding assets.
Structured pilots with contractors, suppliers, and subcontractor workflows.
Pilot conversion, direct sales, customer success, supplier participation.
Success evidence, enterprise contracts, deeper platform intelligence.
Replicate the Saudi playbook across priority GCC markets.
LEAP 202631 Aug - 3 Sep
INVESTOR READ
Commercial proof, not activity noise.
This page shows how QUOTAH turns LEAP conversations into qualified pilots, supplier and subcontractor participation, case studies, and ready-to-pay customers. The numbers below stay connected to the investor dashboard, so funding, valuation, revenue, contractors, suppliers, and ROI move together.
WHAT THE INVESTOR SHOULD UNDERSTAND
The raise is tied to a proof engine.
QUOTAH is not asking for capital only to build product. The BD system is designed to create proof that contractors will use the platform, suppliers will respond, and pilots can become paid accounts.
Contractors, MEP, fit-out, suppliers, ERP partners, and investors are separated by value and next action.
Meetings are scored by project relevance, budget owner, RFQ pain, and willingness to pilot.
Each pilot has a baseline, a supplier cohort, a measured workflow, and a commercial next step.
The output is a case study, LOI, paid proposal, or investor-ready traction evidence.
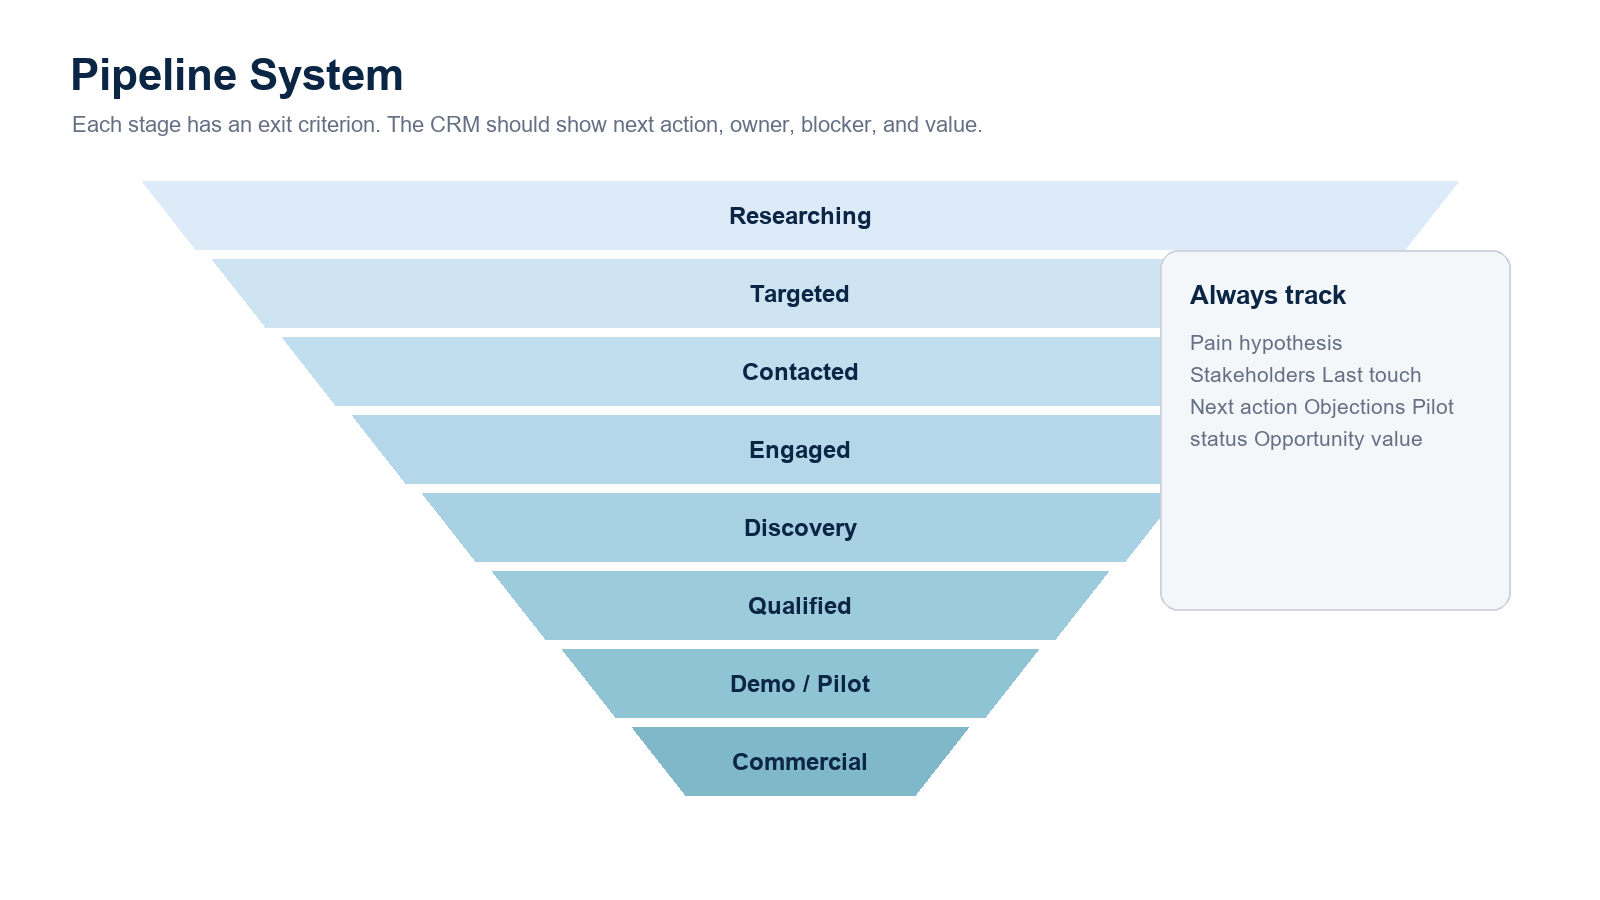
90-Day Proof Funnel
From named accounts to ready-to-payInvestor Evidence
What counts as real tractionExecution Timeline
What happens whenTarget Focus
Who we pursue firstWeekly Rhythm
How momentum is controlledUse the dashboard in the right order.
This guide explains what each page is for, what to check first, which assumptions control the numbers, and how to prepare an investor-ready view without breaking the model.
Start with Base, Downside, or Upside. Load a saved case only if you already created one for a meeting.
Use Period From and Period To to decide which years the pages should explain.
Change one assumption at a time, then review the affected page before making another change.
Read Data Validation Warnings before sending numbers outside the team.
Use Present for meetings and Export Pack for the investor files and evidence snapshot.
PAGE GUIDE
What each page is for
Read the dashboard like an investor story: opportunity, round, growth engine, economics, cash, valuation, business plan, execution, then manual.
Executive Overview
Use it for: the five-minute investor summary.
Check: revenue, net profit, cash, LTV/CAC, readiness warnings, and the headline chart.
Moved by: scenario, period, revenue growth, market share, margin, payroll, CAC, funding, and valuation multiple.
Investment Ask
Use it for: explaining the SAR 3M round, valuation, ownership, and use of proceeds.
Check: pre-money, post-money, investor equity, ROI, funding allocation, and valuation bridge.
Moved by: investment amount, pre-money valuation, ARR multiple, equity, and use-of-funds percentages.
Revenue Growth
Use it for: proving the adoption ramp behind revenue.
Check: monthly revenue, active contractors, platform subscriptions, new contractors, suppliers, enterprise/API clients, and usage.
Moved by: contractor ramp, supplier ramp, platform subscription, enterprise clients, API clients, usage frequency, ACE, APE, and RFQ.
Revenue Mix
Use it for: showing where revenue comes from and how balanced the model is.
Check: ACE, APE, RFQ, platform subscriptions, enterprise/API, marketplace commission, and annual mix.
Moved by: pricing, platform subscription, transaction volume, supplier PO value, subcontractor PO value, commission, and usage frequency.
Cost Structure
Use it for: checking whether spend matches the growth plan.
Check: payroll, sales, product, cloud, operations, contingency, and the role headcount editor.
Moved by: payroll growth, hiring, salary increase, cloud usage, AI unit cost, marketing, G&A, product, and contingency.
Burn & Runway
Use it for: testing cash safety under each scenario.
Check: opening cash, monthly revenue, operating burn, net burn, closing cash, and runway.
Moved by: funding, revenue ramp, payroll, hiring, cloud, sales spend, and contingency.
P&L
Use it for: explaining how growth becomes profit.
Check: revenue, COGS, gross profit, OPEX, EBITDA, tax, net profit, and net margin.
Moved by: revenue drivers, COGS rate, gross margin, OPEX growth, payroll, and tax rate.
Cash Flow
Use it for: reconciling the investment with ending liquidity.
Check: capital raised, cash in, cash out, burn, net cash flow, closing cash, and runway.
Moved by: capital raised, revenue ramp, cash in/out, burn, and operating cost assumptions.
Unit Economics
Use it for: proving customer acquisition can scale profitably.
Check: CAC, ARPC, LTV, LTV/CAC, gross margin, and marketplace commission.
Moved by: CAC, ARPC, LTV period, AI cost, cloud cost, support cost, gross margin, and commission.
Valuation & Scenarios
Use it for: pressure-testing investor return across cases.
Check: Y5 revenue basis, ARR multiple, enterprise value, investor value, ROI, warnings, and sensitivity.
Moved by: revenue source, ARR multiple, funding, pre-money, equity, revenue growth, CAC, margin, payroll, and scenario.
Business Plan
Use it for: presenting the full QUOTAH business plan in one investor-readable page.
Check: CIOS thesis, 20-chapter coverage, product ecosystem, revenue model, GTM, roadmap, risks, governance, and PDF download.
Moved by: funding, pre-money valuation, investor equity, ROI, SAM contractors, market share, revenue, suppliers, and cash assumptions.
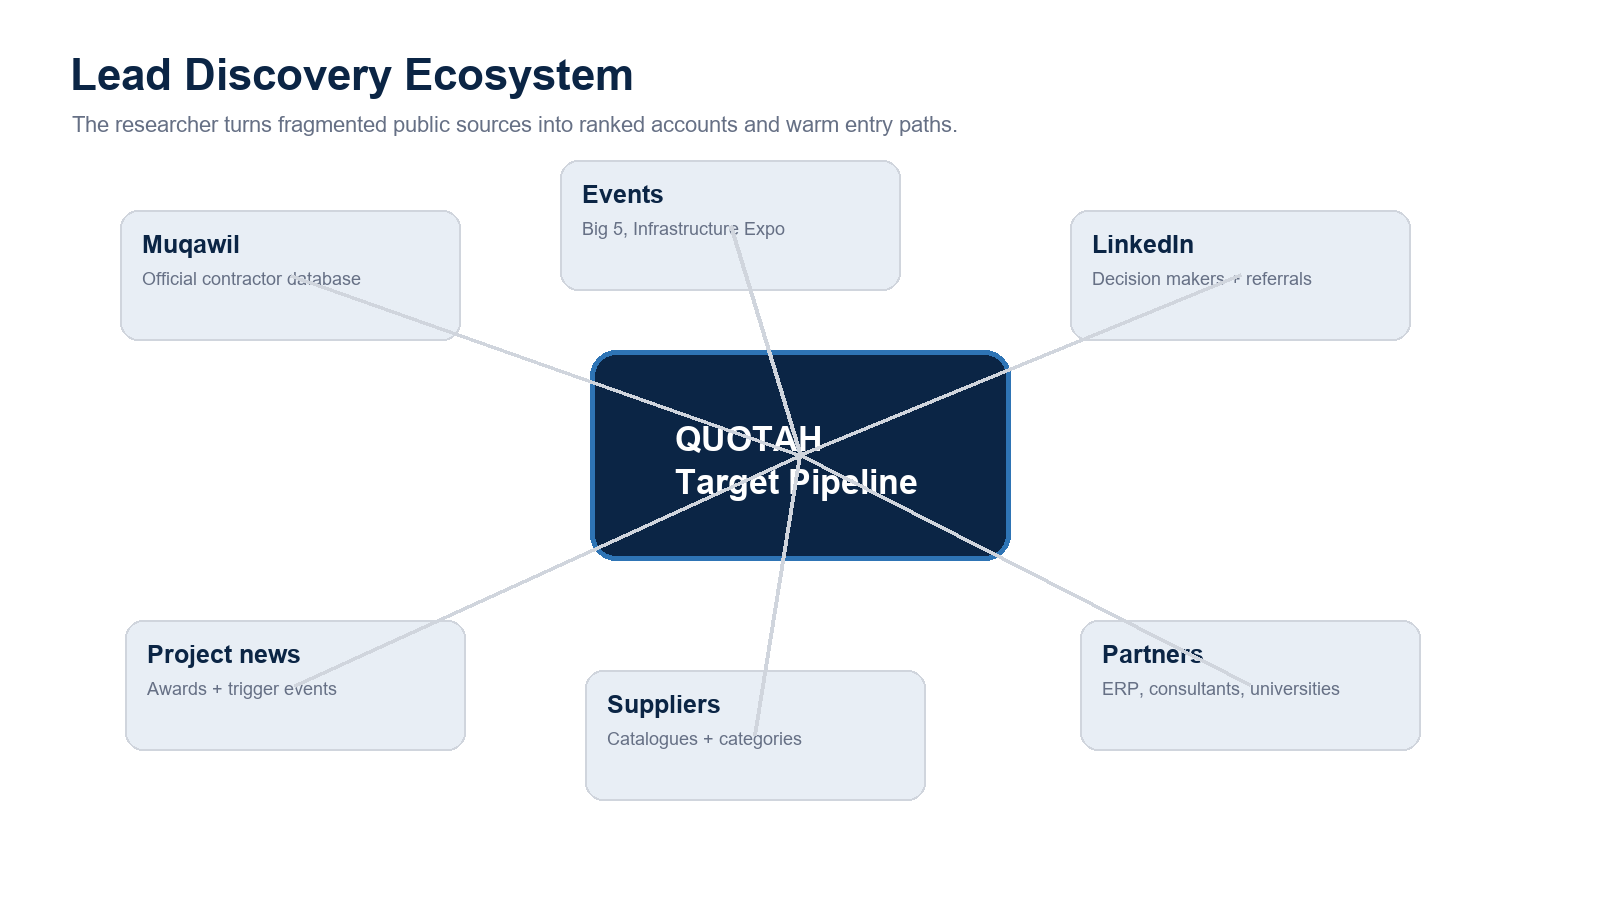
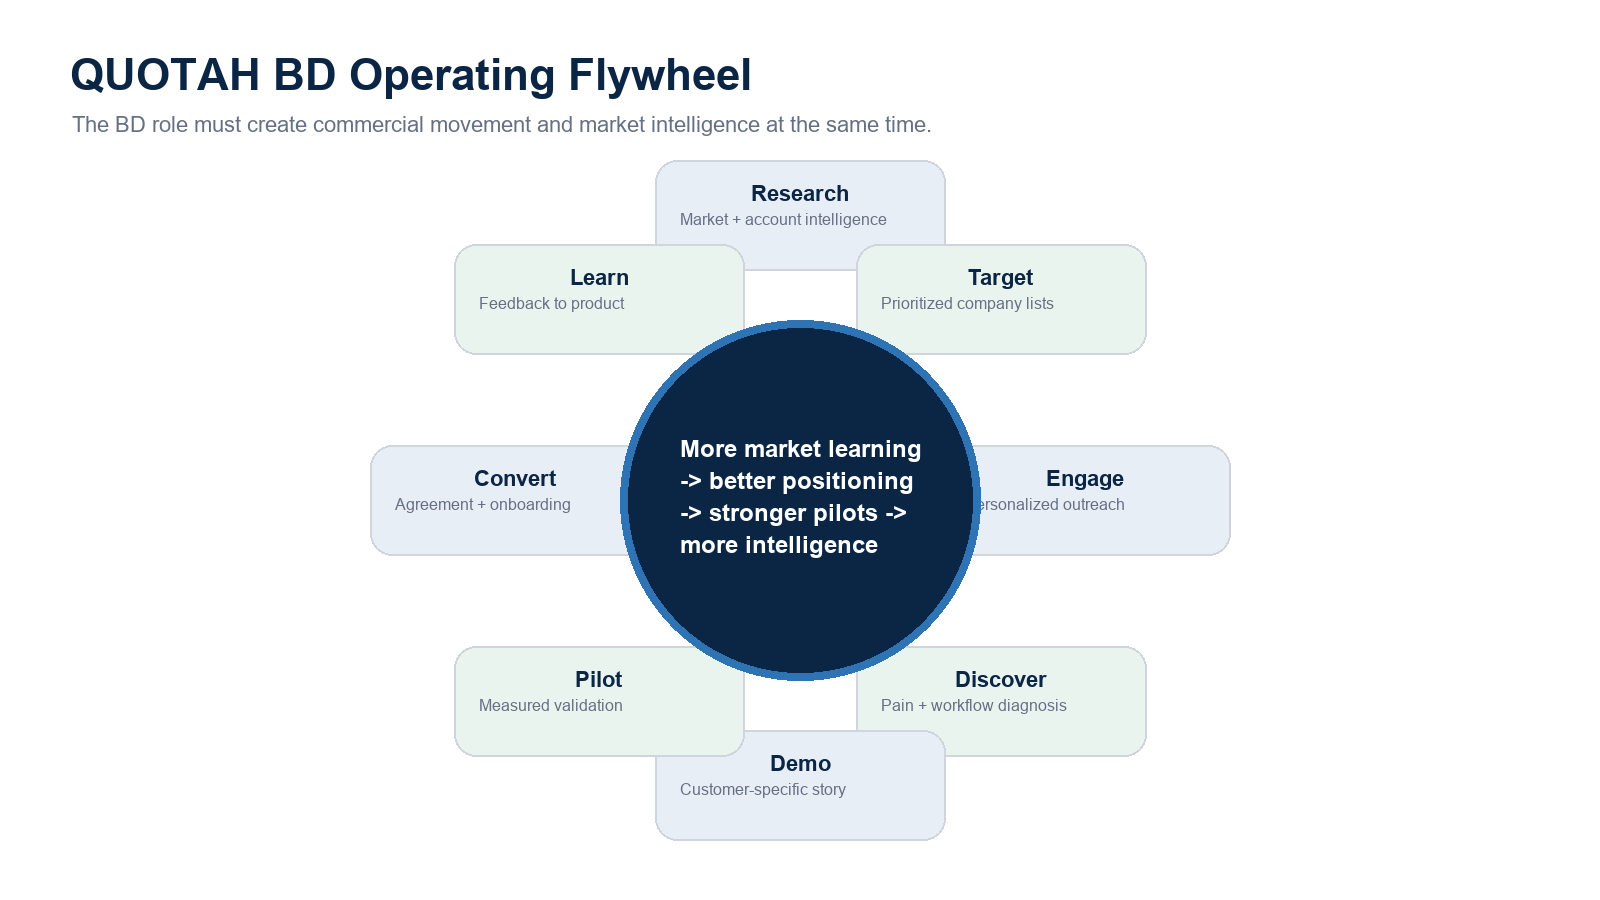
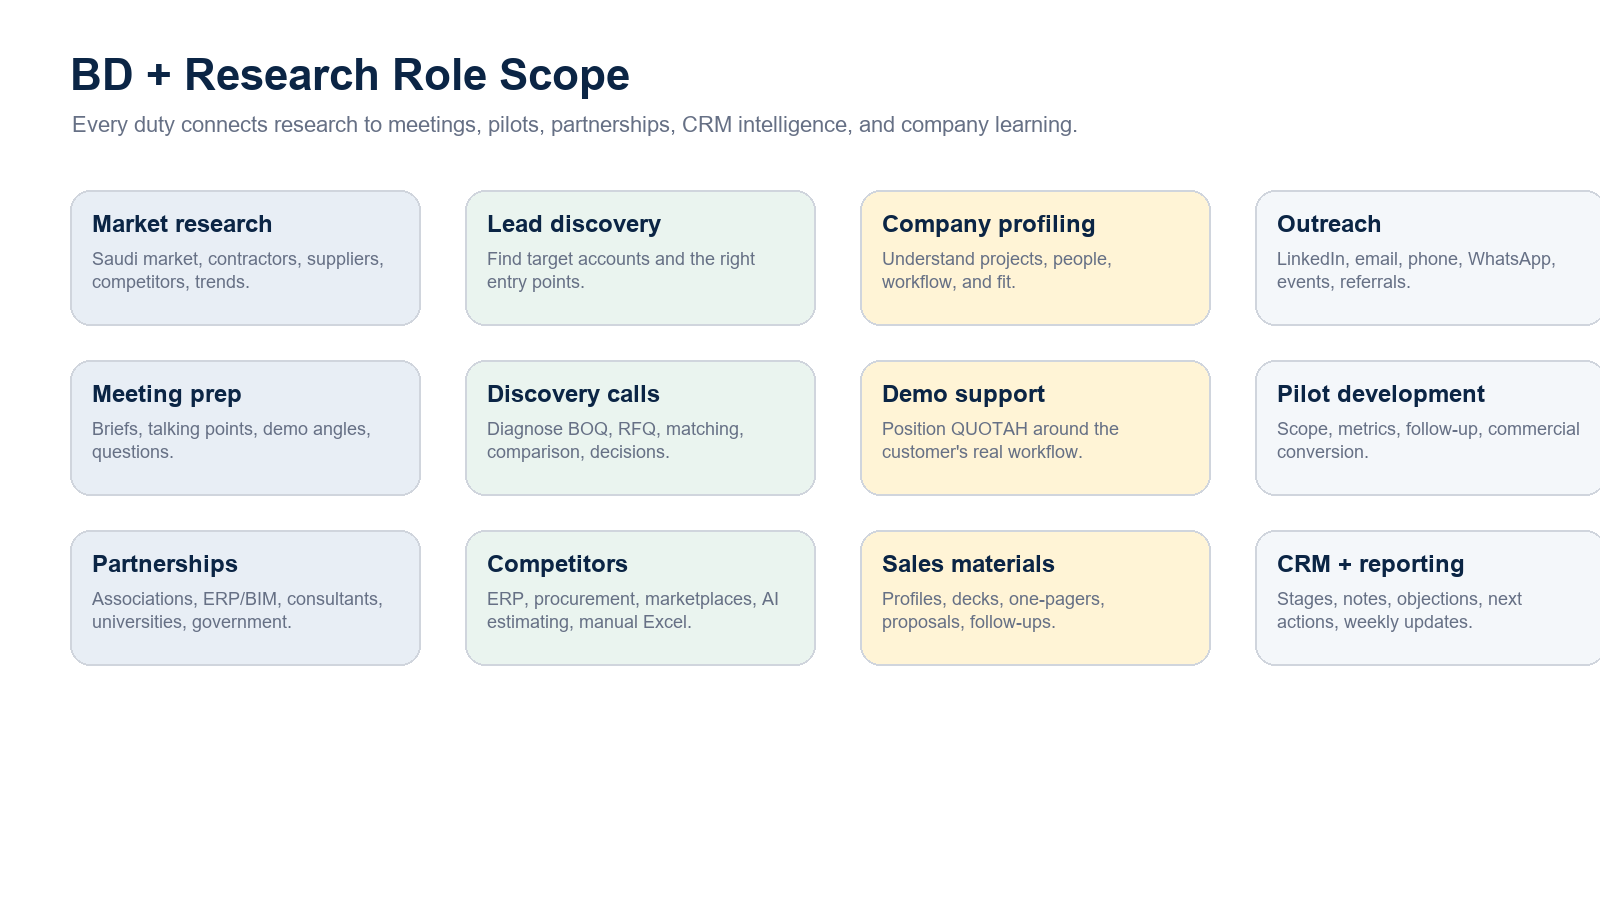
Business Development
Use it for: connecting the LEAP and 90-day BD plan to the financial model.
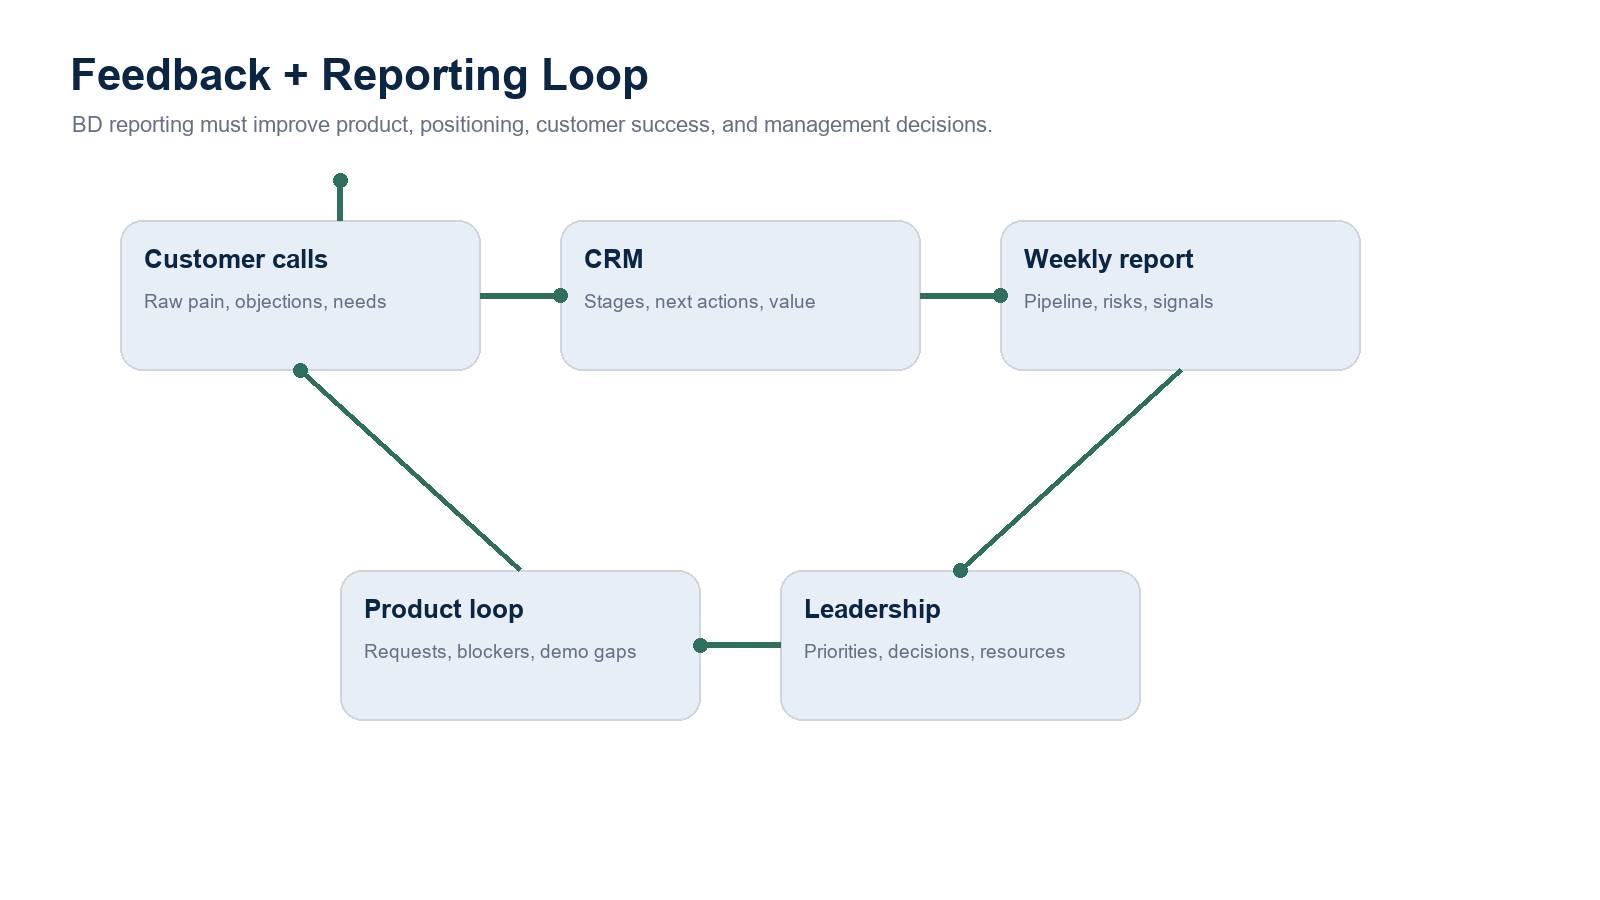
Check: objective, funnel, pilot targets, weekly cadence, risks, and live KPI cards.
Moved by: scenario, funding, revenue, contractors, suppliers, unit economics, valuation, and cash assumptions.
User Manual
Use it for: onboarding anyone who needs to operate or review the dashboard.
Check: workflow, page explanations, editor controls, meeting flow, and export steps.
Moved by: language and theme only. Financial assumptions do not change the manual text.
ASSUMPTION EDITOR
How the right-side controls work
The editor is the control room. Every change updates the visible pages immediately, so use small changes and save important cases.
Scenario workspace
Base, Downside, and Upside apply predefined assumptions. Scenario name, Save, Load, Duplicate, and Compare let you preserve meeting cases in the browser.
Global filters
Currency changes display only. Period From and Period To control which years are included. Chart View changes how the data is displayed.
Market drivers
SAM contractors, market share, and supplier penetration control market scale, adoption logic, and revenue potential.
Revenue and pricing
Growth, contractor ramp, supplier ramp, usage frequency, ACE/APE/RFQ pricing, platform subscription, enterprise subscriptions, PO values, and commission control revenue by stream.
Cost and burn
Payroll, hiring, salary increase, cloud, AI cost, sales, G&A, product, contingency, COGS, OPEX, and tax control cost, profit, and runway.
Funding and valuation
Investment amount, use of funds, ARR multiple, pre-money valuation, Y5 revenue source, and investor equity control ownership, enterprise value, ROI, and sensitivity.
Import and reset
Import reads a refreshed workbook. Use built-in returns to the audited built-in model. Reset restores the dashboard to the base case.
Presentation and export
Present hides editing clutter for meetings. Export PDF opens browser printing. Export Pack downloads the investor files, assumptions, warnings, KPIs, and chart images.
Charts and tables
Chart legends toggle series, hover shows exact values, and chart tools zoom, restore, or save images where available.
MEETING FLOW
Best sequence for an investor review
This order keeps the discussion simple: what QUOTAH is building, why the round is sized correctly, how revenue scales, and what return the investor can underwrite.
Open the site, enter the password, confirm Base case, check the SAR 3M ask, SAR 18M pre-money, SAR 21M post-money, and read warnings.
Use Executive Overview, Investment Ask, Business Plan, Revenue Growth, Revenue Mix, Unit Economics, Valuation, and Business Development in that order.
Change one assumption, explain which page changed, then save the case if it becomes part of the discussion.
Export the pack so the investor receives the same assumptions, KPIs, warnings, and charts that were reviewed live.